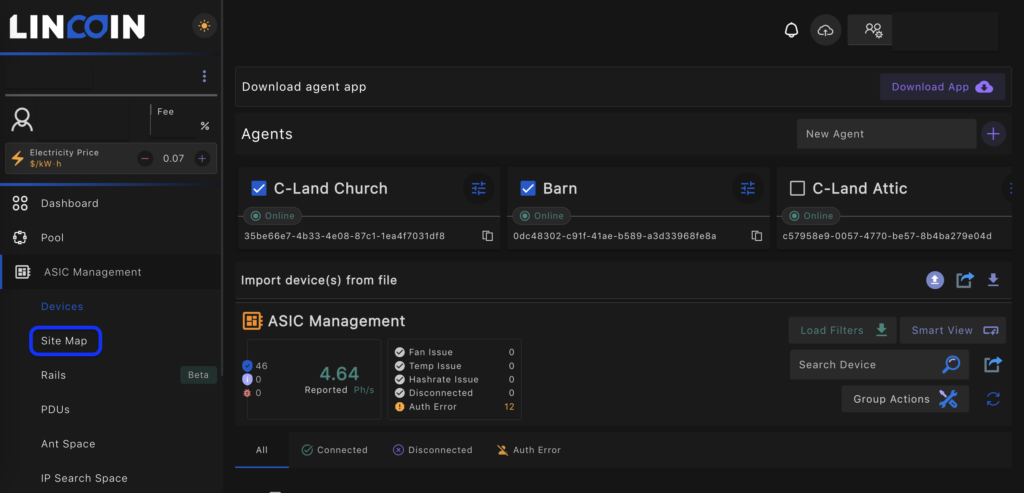
Lincoin ASIC Management platform SiteMap tool provides site mapping to aid in management. With the site map the operator is able to easily locate workers for repair, maintenance and analyze inefficiencies that may be the result of environmental issues of a workers physical location. Site Map can be accessed from the main menu under Asic Management.
The site map provides a visual representation of worker location and real time data on the racks. Functions that can be done in the Asic Management tab can also be executed from the site map either per group(container/building), rack, or worker levels.
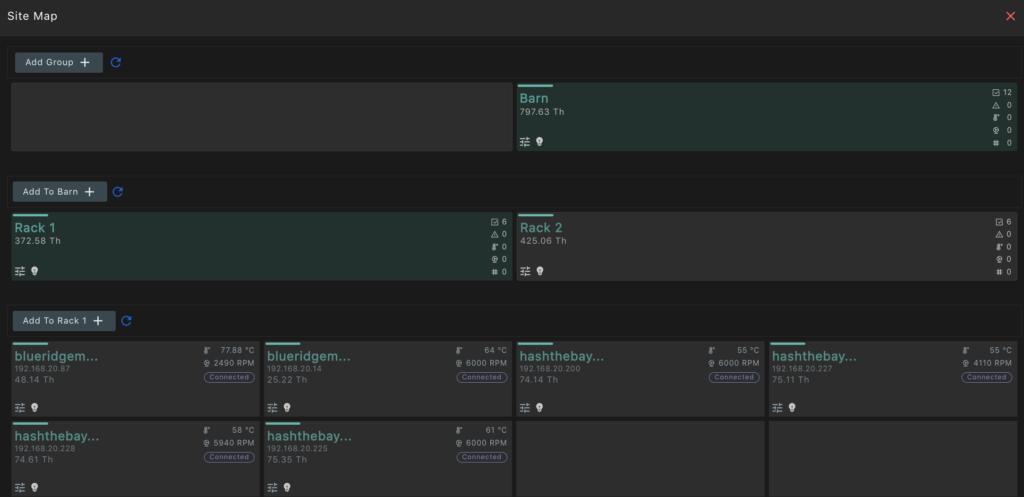
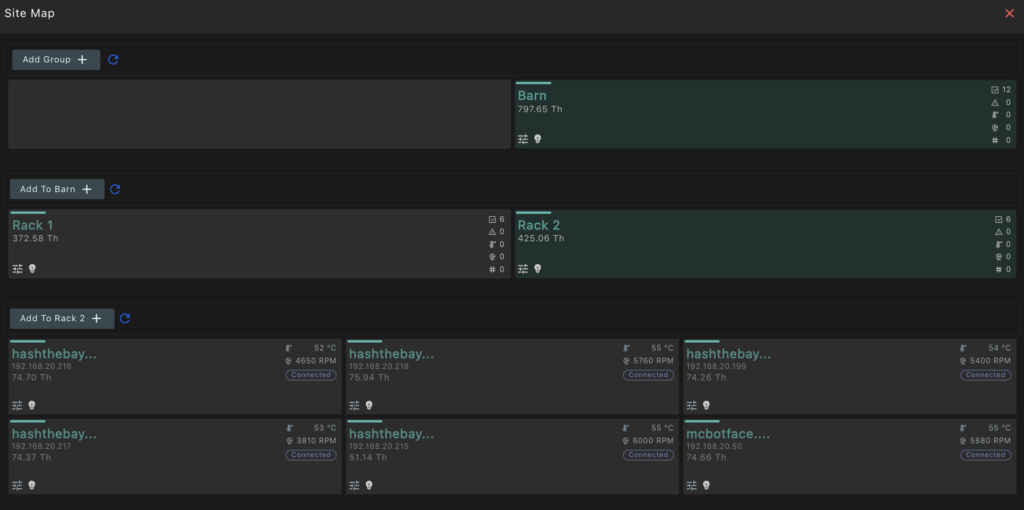
The visual display includes Worker Name, IP address, Realtime Hashrate, Chip Temperatures, Fan Speed, and Connection Status.

Additionally, the lower left quadrant includes a miner control icon and LED on/off icon.
Creating the Sitemap
The site map is designed utilizing three levels.
- Group – Your container/pod or other structure
- Rack – this is the rack the workers are located. Racks include rows and columns.
- Worker – The individual worker assigned to the slot
Implementation Options
- Create Sitemap Manually
- Import CSV File
Pick one or the other methods. The CSV import will not work if you have manually set up a Sitemap or have an existing site map that needs editing and your CSV is a different format. Creating the SiteMap is time consuming for a larger facility. Once initial setup is complete it is a matter of editing workers in the rack space. If you need assistance creating the Sitemap, reach out to the team for guidance.
Create Sitemap – Manually
Below is an example of a site with four ANTSPACE pods. For simplicity, we will provide an example of a farm with four containers having one rack per container with 3 rows and 3 columns per rack. This will provide enough inputs for demonstration purposes.

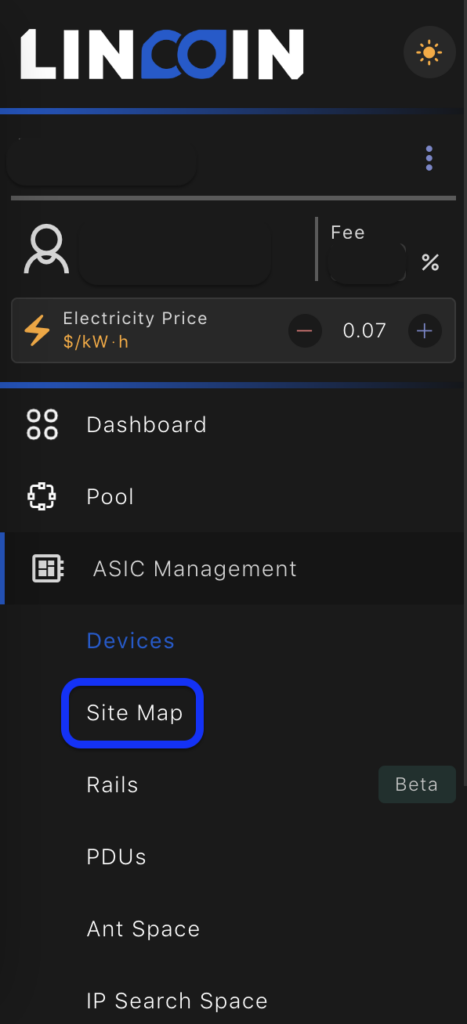
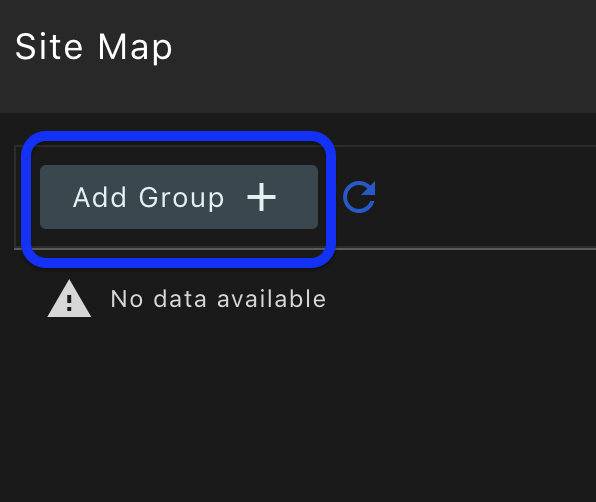
Select “Site Map” under the Asic Management tab to access the tool. Begin by selecting the Add Group button. Name the Group and decide how many rows and columns the group will require.
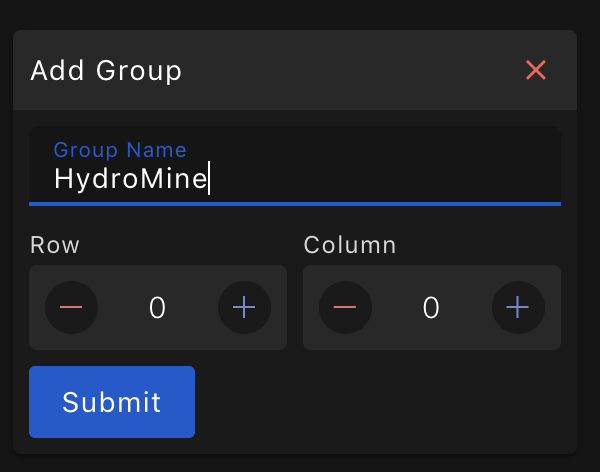
Leave the Row and Column blank or Row = 0, Column = 0. If you add a project site that is developed in the future, add a new Group as another Row or Column. Note that Row and Column numbering begins with 0. 1 is the second Row. Below is an example of the array numbering.

The Example Site Map “Botty’s HydroMine” includes 4 Containers. Therefore, we will create a “Rack” with 4 “Rows”. Select “Add Rack”.
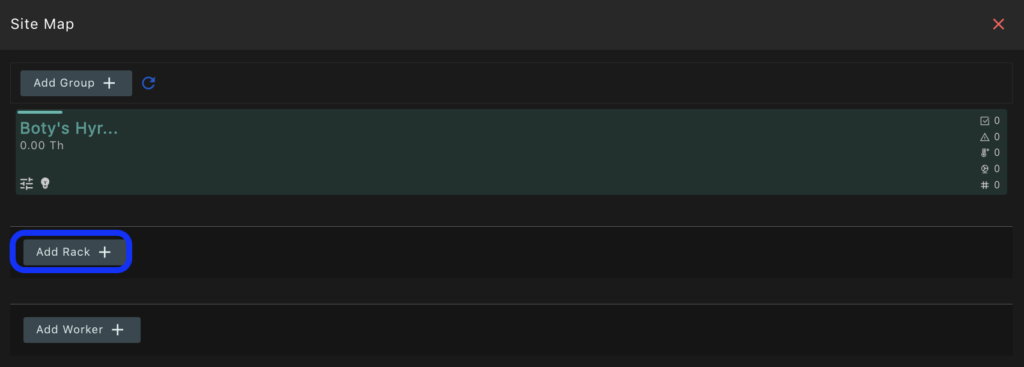
This “Group” is Botty’s first HydroMine in Site Map with 4 Containers. Since we want 4 containers we will increase the row counter to 3 (0,1,2,3) and leave the column number at 0. Recall the array above where 0 is the first row and the first column. If you need 2 rows or 2 columns select “1” in the Add Rack popup window. Screenshots are outlined below.
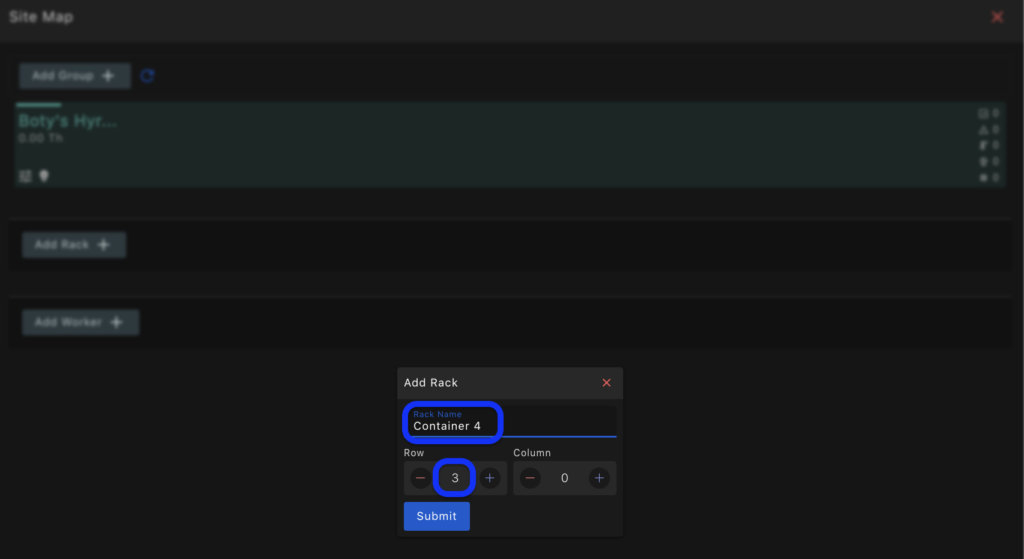
There is now 1 Group, Boty’s HyrdroMine with 4 Containers established in the Site Map. The next step is to add the workers in each container. For the example we have one rack per container with 3 rows and 3 columns per rack. Below is the procedure to add the 3 rows and 3 columns for Container 1. Select Container 1 control icon next to the lightbulb to add workers.
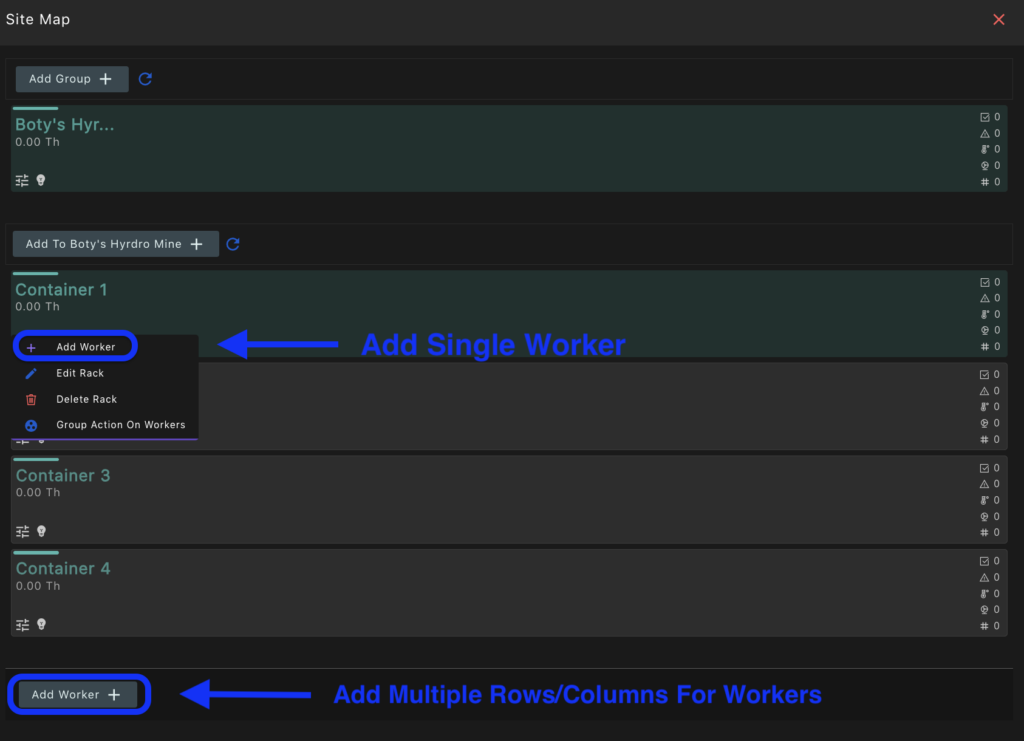
We want 3 rows and 3 columns. Therefore, select 2 for Row and 2 for Column in the popup
window. Next, select the worker you want located in the last position to create the full rack. You can change the worker if you made an error.
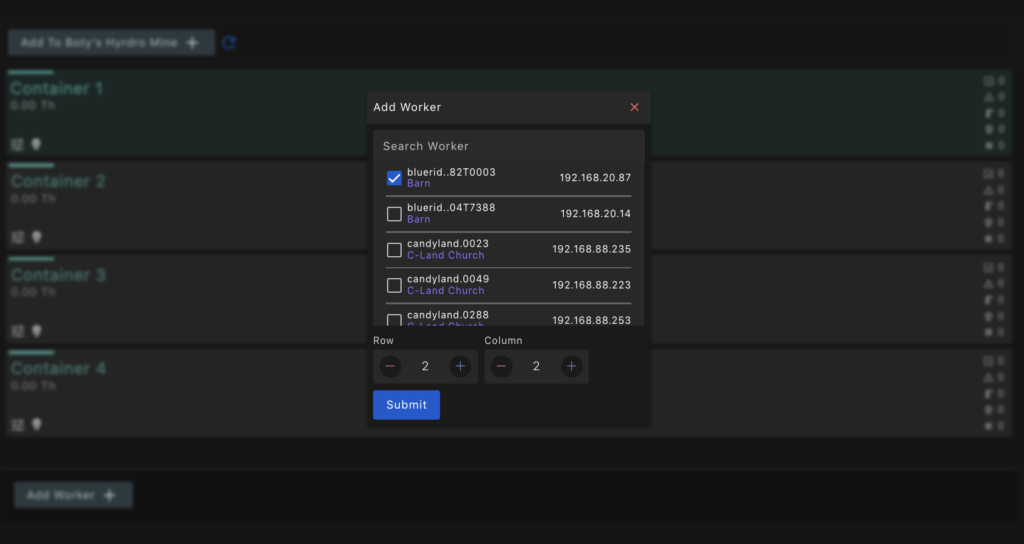
Container 1 now includes 3 rows and 3 columns providing 9 slots on the rack. Select the rack slot you wish to place a worker. In the example above we placed the first worker in Row 2 Column 2. There are 8 spaces left to fill.
To fill the remaining positions in Container 1:
- Select appropriate rack position or select “Add to Container 1 +”. The below example selected position Row 2, Column 1 and added the desired worker..
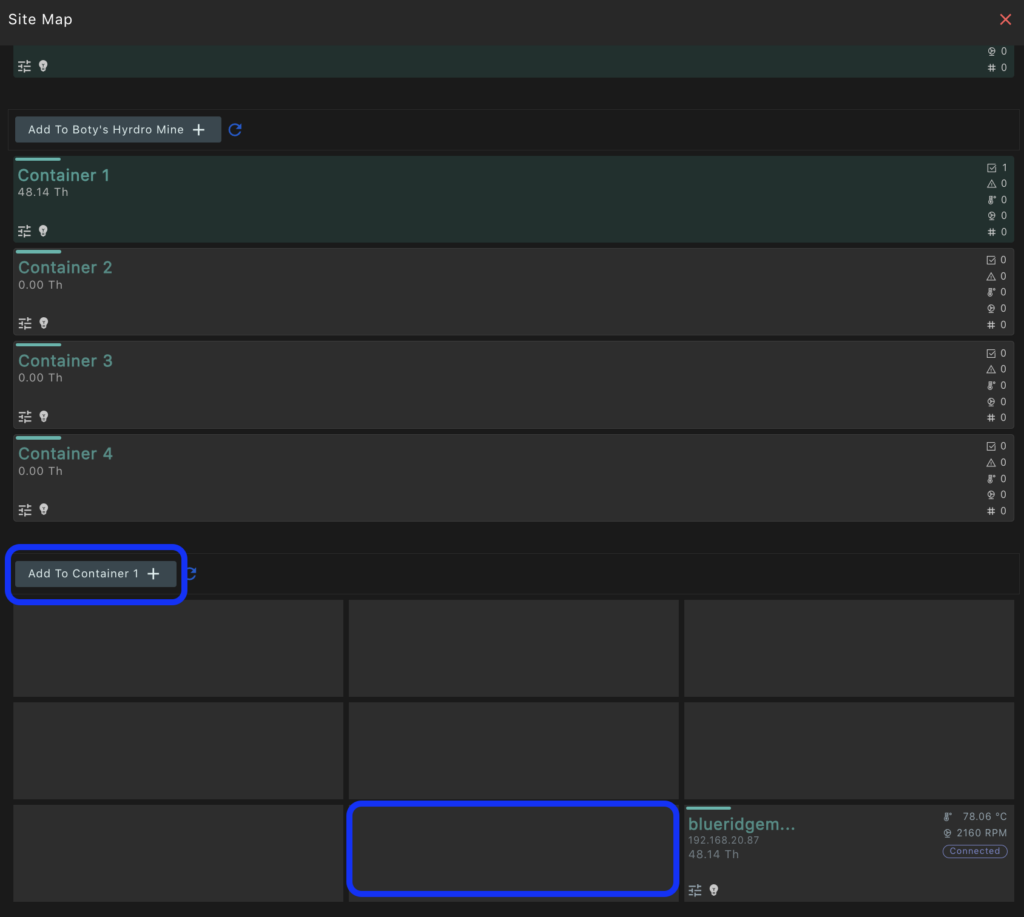
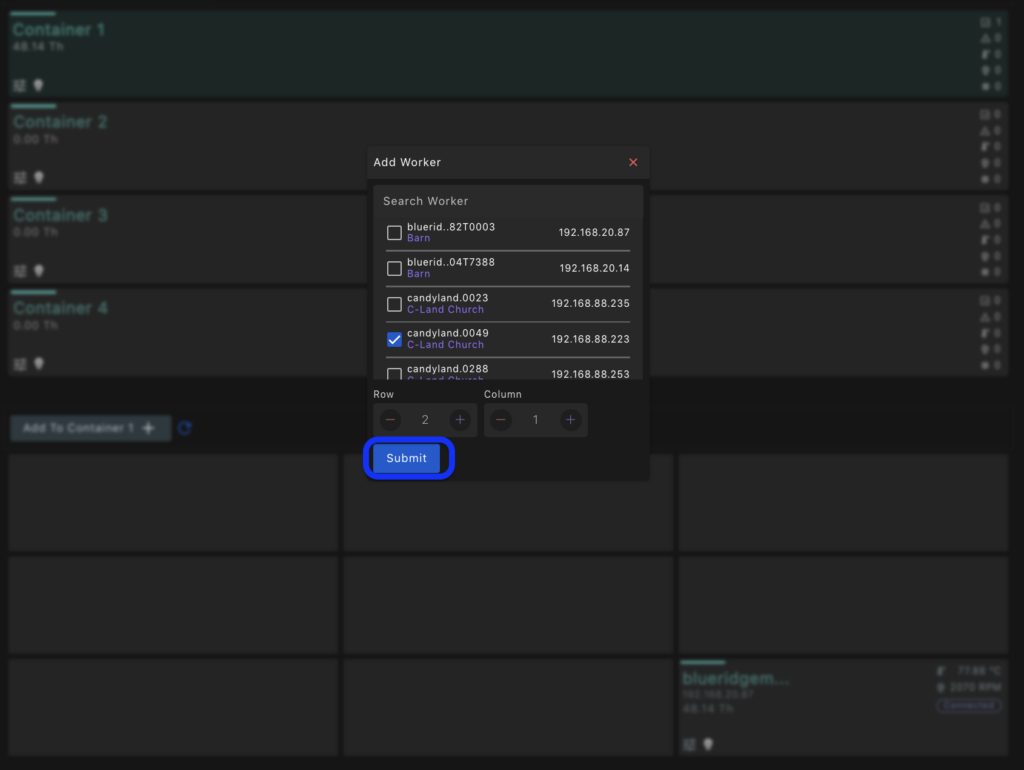
- Repeat the process for the remaining 6 positions. Note if necessary use the Blink LED function from the Devices list to aid in locating specific workers. Once the worker assignment is complete your Container map should look like the image below if all positions are occupied.
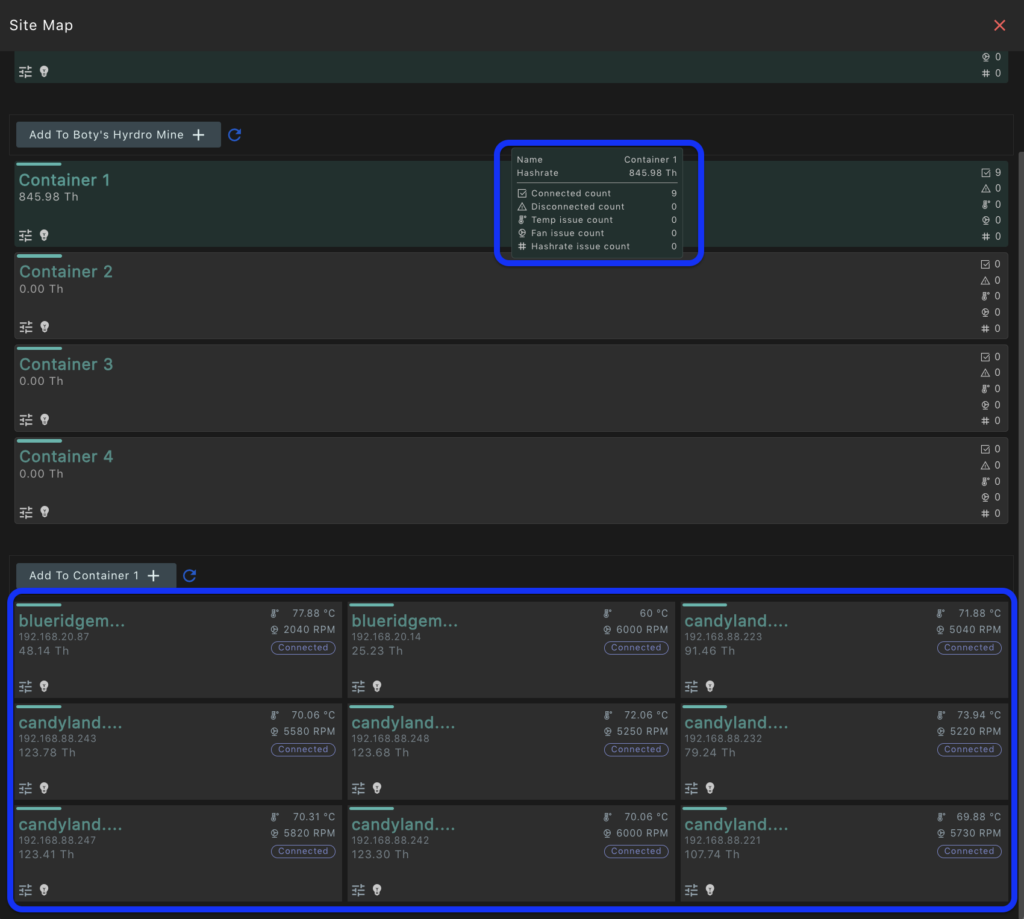
Repeat the process to complete Containers 2 through 3. The tool is customizable to adapt to various configurations. Once worker positions are assigned, positions can be viewed in the Devices tab by hovering over the Coordinates icon as illustrated below.

When Boty is ready to add more containers to the site. He can add a group either in the adjacent column or row depending on site requirements or user preference.

This concludes Create Sitemap – Manually. Following are instructions to Create Sitemap – Import CSV File.
Create Sitemap – Import CSV File
This is the second option to create a site map. It involves exporting the existing list of workers connected to the agent or creating a list manually with the download template provided. With this method it may be best to scan all workers within the site to Agent first, export worker details and add the group, rack, and worker position in the excel/CSV file. To aid in physical location you can flash the LED of the worker and log its location manually or as you go into a spreadsheet on a mobile device. Lastly, upload the edited worksheet to create the sitemap via importing. The steps are outlined as follows:
- Export worker details or template
- Add Group, Rack, Worker locations to export file/template
- Import CSV to Agent
- Review Sitemap for Accuracy
Export worker details or template from the Asic Management > Devices Tab
- Via Template
- Via Exported List of Workers
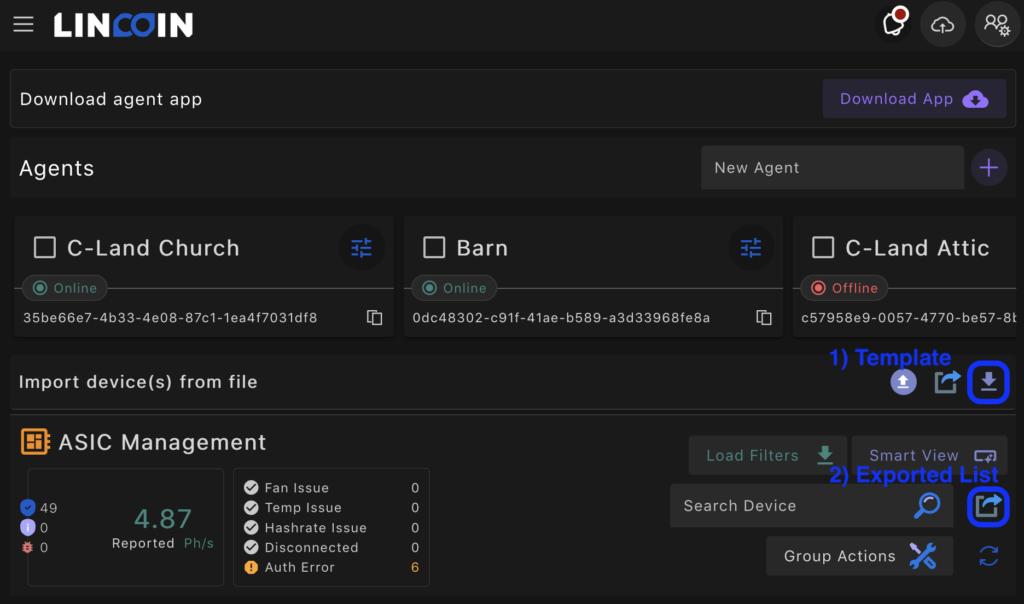
Export Worker Details or Template
For this exercise we chose to obtain the list of workers scanned in the Agent identified as Barn. We selected all the workers under this Agent and exported them to a CSV file.
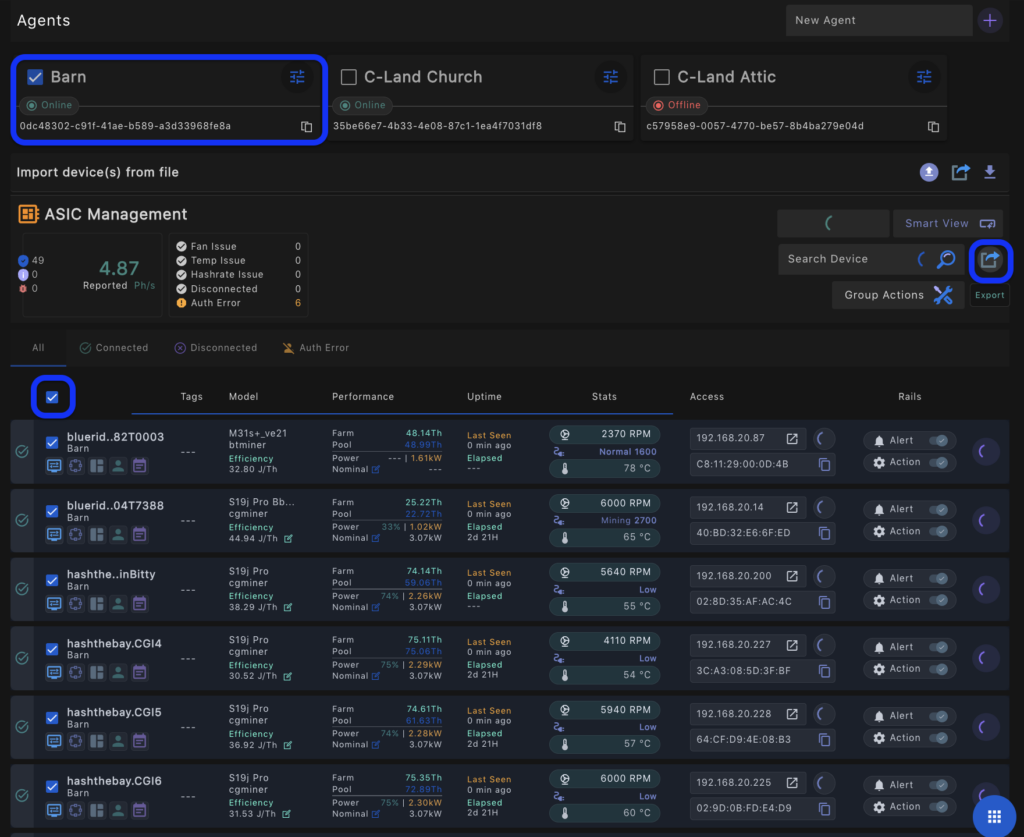
The exported list will look similar to the rendering below. The items that require manual input include the following columns: group_name, group_row, group_column, rack_name, rack_row, rack_column, row, and column (worker position on the rack).

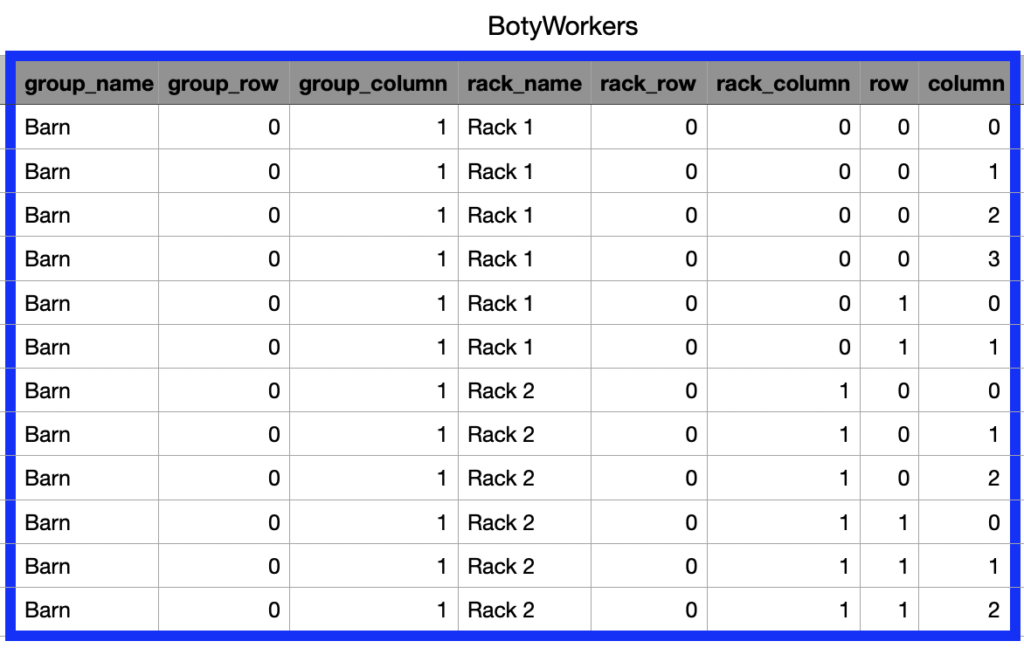
For this example we are adding Group Barn. In the Sitemap, this is Group Row 0, Group Column 1. It will leave us with an empty Group in position (0,0) for expansion. This is not necessary. It is an example if you plan on adding another Group in the future if you want it in that specific position.
*If you have the benefit of running Whatsminer with the MAC address barcode on the control board case you can scan the barcode with a mobile device and paste into an spreadsheet for upload.
Import CSV to Agent
We are creating 2 racks with 2 rows on each rack; 4 columns for Rack 1 (0,1,2,3) and 3 columns for Rack 2 (0,1,2). Once your Group, Rack Name, Rack positions, and worker positions are entered save the file as a CSV and upload into the Agent Tool as follows:

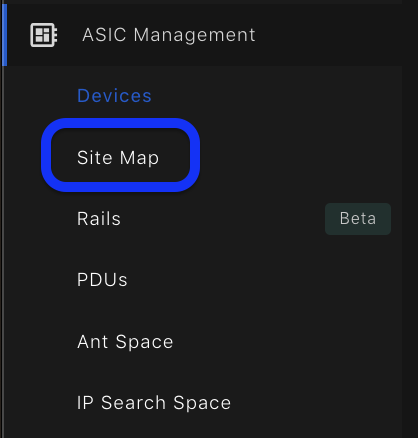
After successful upload, select the site map in the left hand menu, under Asic Management > Devices to view the Sitemap.
All goes well you should see a Sitemap similar to this.
This concludes the Import CSV File example.
In summary, the Site Map tool allows the user to visualize worker position to observe performance or execute group actions within the operation. You have two options for Sitemap creation.
- Create Sitemap Manually
- Import CSV File
SiteMap creation can get a little tricky at scale. Drawing out the site map and filling in worker information manually on paper or a spreadsheet on a mobile device can be helpful. If you have any issues or questions about setting this up feel free to reach out to the team over Telegram.
